
 Posted By
Bajarangi soft ,
Posted On 27-11-2020
Posted By
Bajarangi soft ,
Posted On 27-11-2020
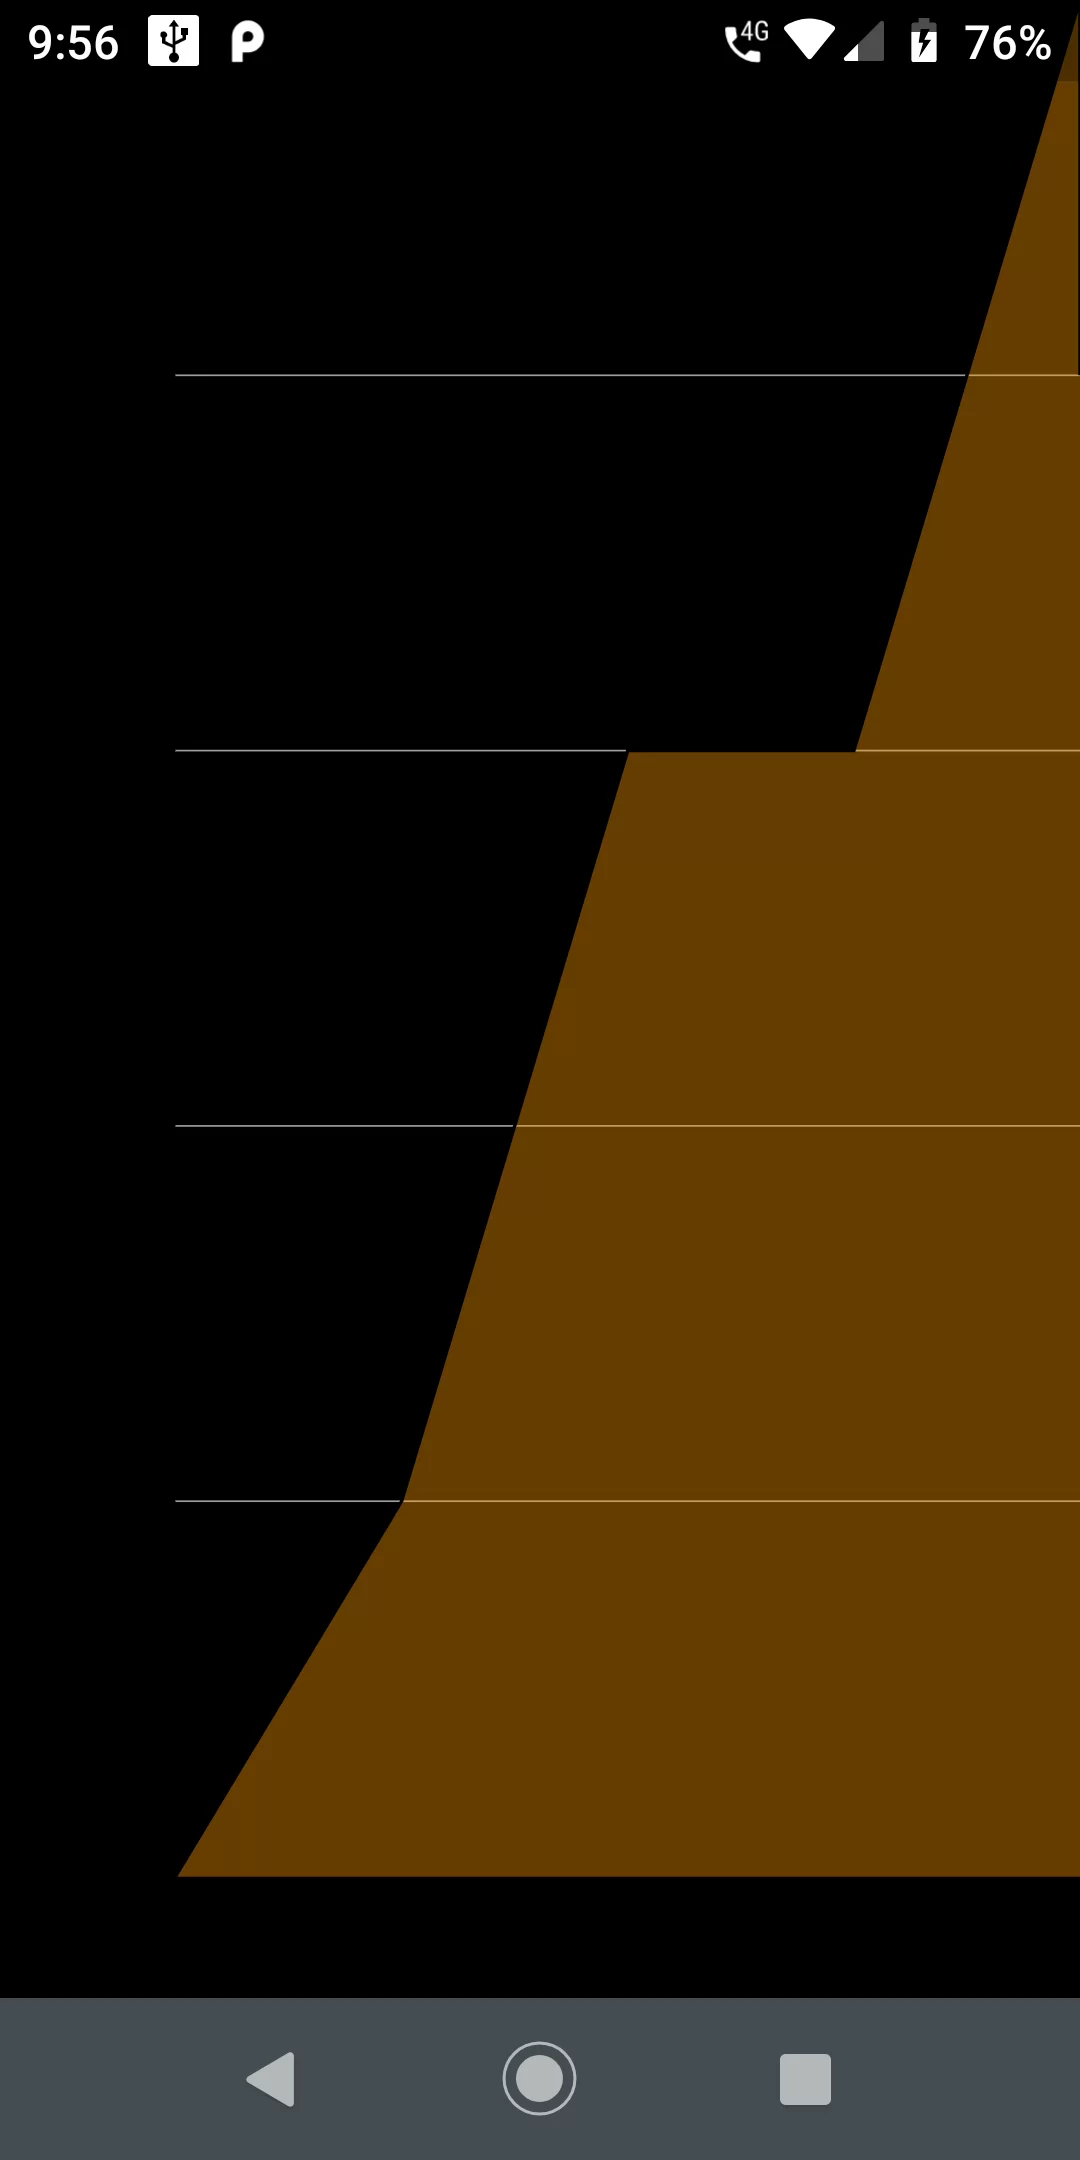
Fl Charts
Step 1
We cannot directly remove the time stamp from Fl Charts but using the intl.dart package we can easily filter the date stamp from time stamp. So open your flutter project’s pubspec.yaml in code .
dependencies:
  flutter:
    sdk: flutter
  fl_chart: ^0.10.1
flutter pub get
import 'package:flutter/material.dart';
import 'package:fl_chart/fl_chart.dart';

void main() => runApp(MyApp());

class MyApp extends StatelessWidget {
  @override
  Widget build(BuildContext context) {
    return MaterialApp(
      debugShowCheckedModeBanner: false,
      title: 'Flutter Slidable ListView',
      theme: ThemeData(
        primarySwatch: Colors.blue,
      ),
      home: MyHomePage(title: 'Flutter Slidable ListView'),
    );
  }
}

class MyHomePage extends StatefulWidget {
  MyHomePage({Key key, this.title}) : super(key: key);

  final String title;

  @override
  _MyHomePageState createState() => _MyHomePageState();
}

class _MyHomePageState extends State<MyHomePage> {
  @override
  Widget build(BuildContext context) {
    const cutOffYValue = 0.0;
    const yearTextStyle =
    TextStyle(
        fontSize: 10,
        color: Colors.black,
        fontWeight: FontWeight.bold
    );
    return SizedBox(
      width: 330,
      height: 180,
      child: LineChart(
        LineChartData(
          lineTouchData: LineTouchData(enabled: false),
          lineBarsData: [
            LineChartBarData(
              spots: [
                FlSpot(0, 0),
                FlSpot(1, 1),
                FlSpot(2, 3),
                FlSpot(3, 3),
                FlSpot(4, 5),
                FlSpot(4, 4)
              ],
              isCurved: false,
              barWidth: 1,
              colors: [
                Colors.black,
              ],
              belowBarData: BarAreaData(
                show: true,
                colors: [Colors.orange.withOpacity(0.4)],
                cutOffY: cutOffYValue,
                applyCutOffY: true,
              ),
              aboveBarData: BarAreaData(
                show: true,
                colors: [Colors.red.withOpacity(0.6)],
                cutOffY: cutOffYValue,
                applyCutOffY: true,
              ),
              dotData: FlDotData(
                show: false,
              ),
            ),
          ],
          minY: 0,
          titlesData: FlTitlesData(
            bottomTitles: SideTitles(
                showTitles: true,
                reservedSize: 6,
                textStyle: yearTextStyle,
                getTitles: (value) {
                  switch (value.toInt()) {
                    case 0:
                      return '2017';
                    case 1:
                      return '2018';
                    case 2:
                      return '2019';
                    case 3:
                      return '2020';
                    case 4:
                      return '2021';
                    default:
                      return '';
                  }
                }),
            leftTitles: SideTitles(
              showTitles: true,
              getTitles: (value) {
                return '\$ ${value + 20}';
              },
            ),
          ),
          axisTitleData: FlAxisTitleData(
              leftTitle: AxisTitle(showTitle: true, titleText: 'Value', margin: 10),
              bottomTitle: AxisTitle(
                  showTitle: true,
                  margin: 10,
                  titleText: 'Year',
                  textStyle: yearTextStyle,
                  textAlign: TextAlign.right)),
          gridData: FlGridData(
            show: true,
            checkToShowHorizontalLine: (double value) {
              return value == 1 || value == 2 || value == 3 || value == 4;
            },
          ),
        ),
      ),
    );
  }
}